Model Performance & Results
Evaluation metrics and performance plots derived from training 4 machine learning models on 33,716 Enron emails with 5-fold cross-validation.
Logistic Regression
Selected for production deployment based on achieving the highest overall F1-Score (0.9896) and highest Accuracy (99.00%) with low false negative rates.
4-Model Algorithm Performance Comparison
Test Split: 6,097 Emails| Model Algorithm | Accuracy | Precision | Recall | F1-Score | Training Time | Status |
|---|---|---|---|---|---|---|
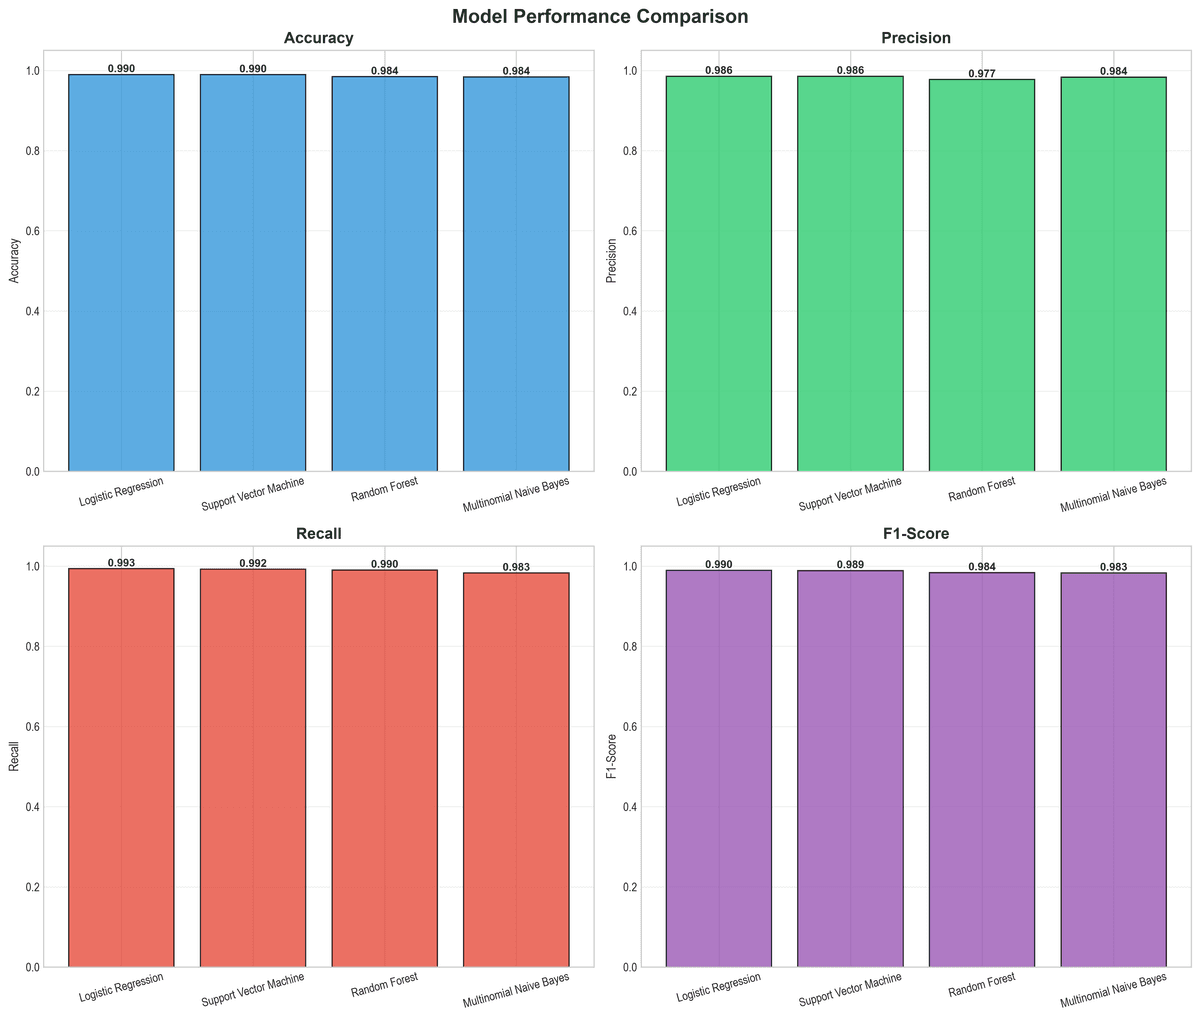
| Logistic Regression | 99.00% | 98.57% | 99.35% | 0.9896 | 5.18s | DEPLOYED |
| Support Vector Machine | 98.95% | 98.57% | 99.25% | 0.9891 | 9.15s | EVALUATED |
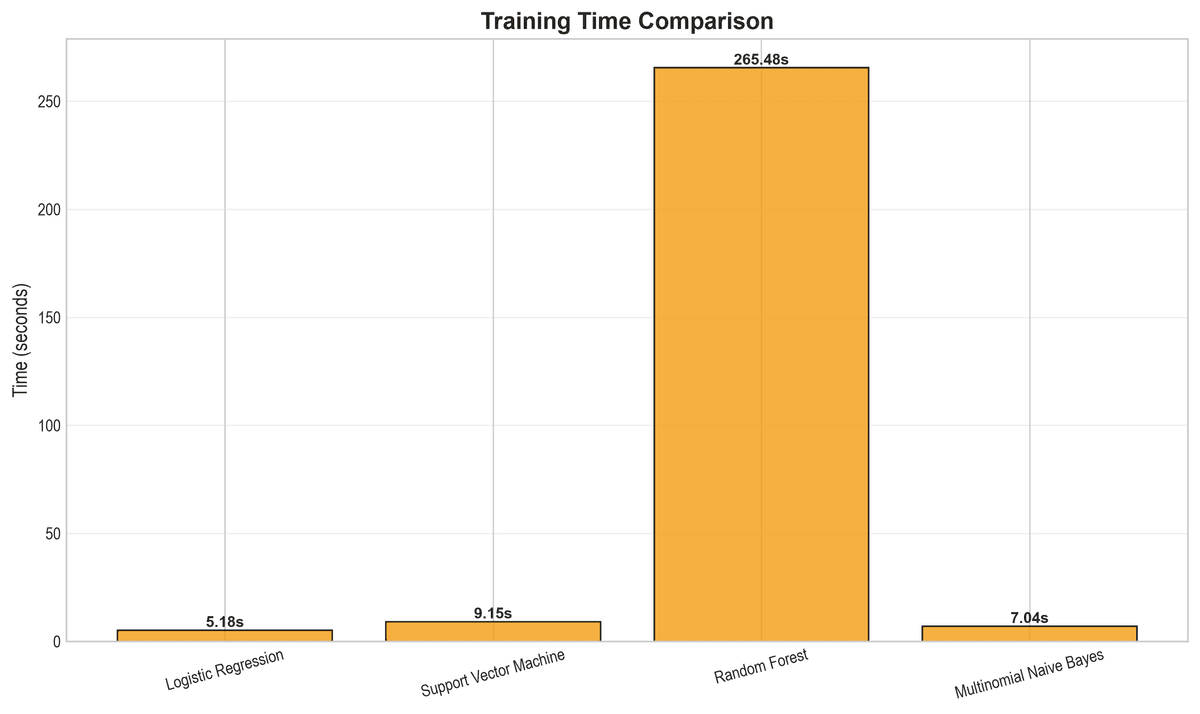
| Random Forest | 98.44% | 97.73% | 99.04% | 0.9838 | 265.48s | EVALUATED |
| Multinomial Naive Bayes | 98.39% | 98.35% | 98.28% | 0.9832 | 7.04s | EVALUATED |
Python Training Visualizations & Plots
Original graphical plot figures generated directly from the scikit-learn model evaluation pipeline.
1. Model Metrics Comparison
Comparison of Accuracy, Precision, Recall, and F1-Score across all 4 algorithms.
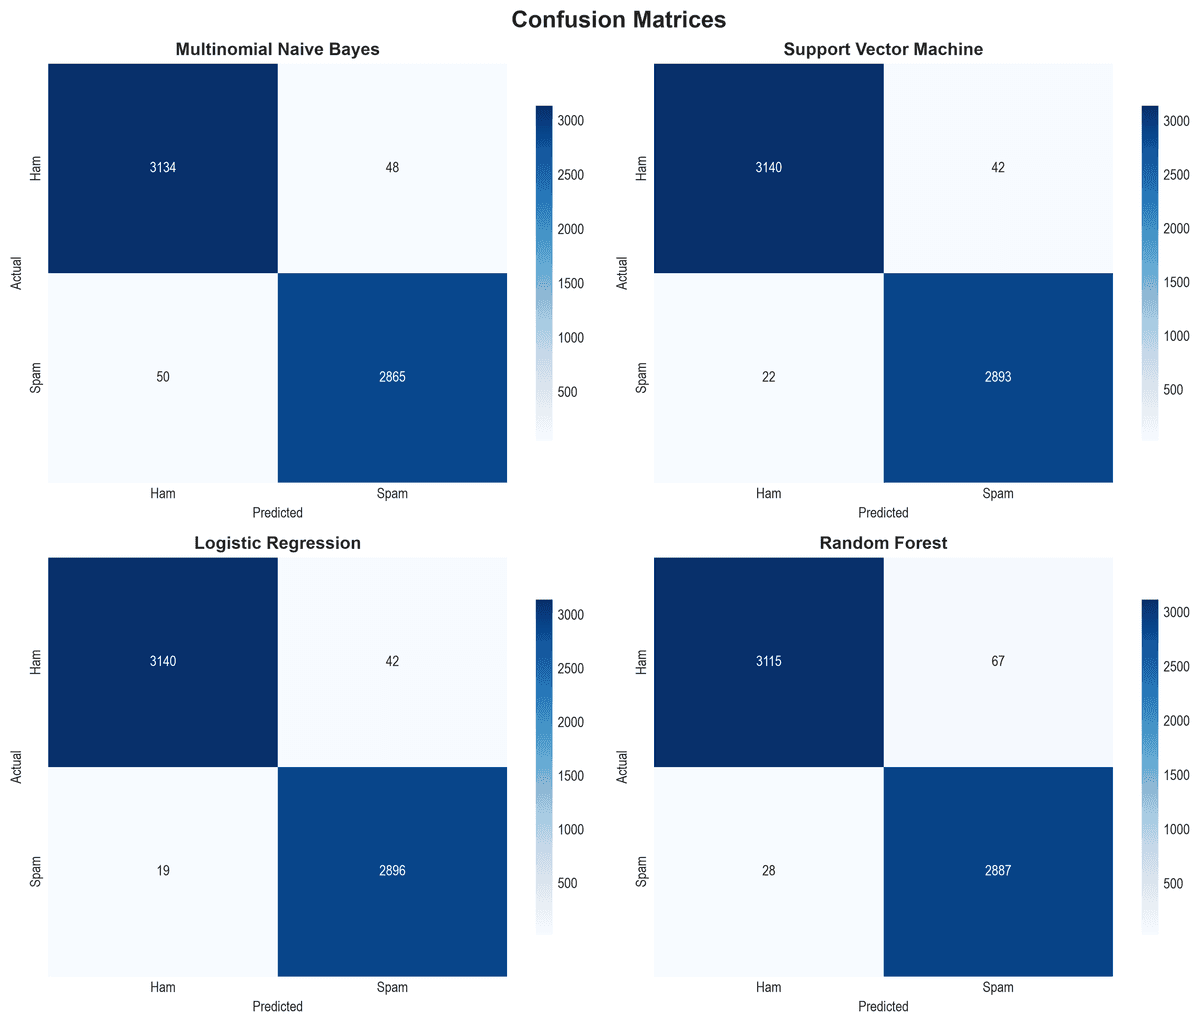
2. Confusion Matrices
True Positive, True Negative, False Positive, and False Negative counts for each model.
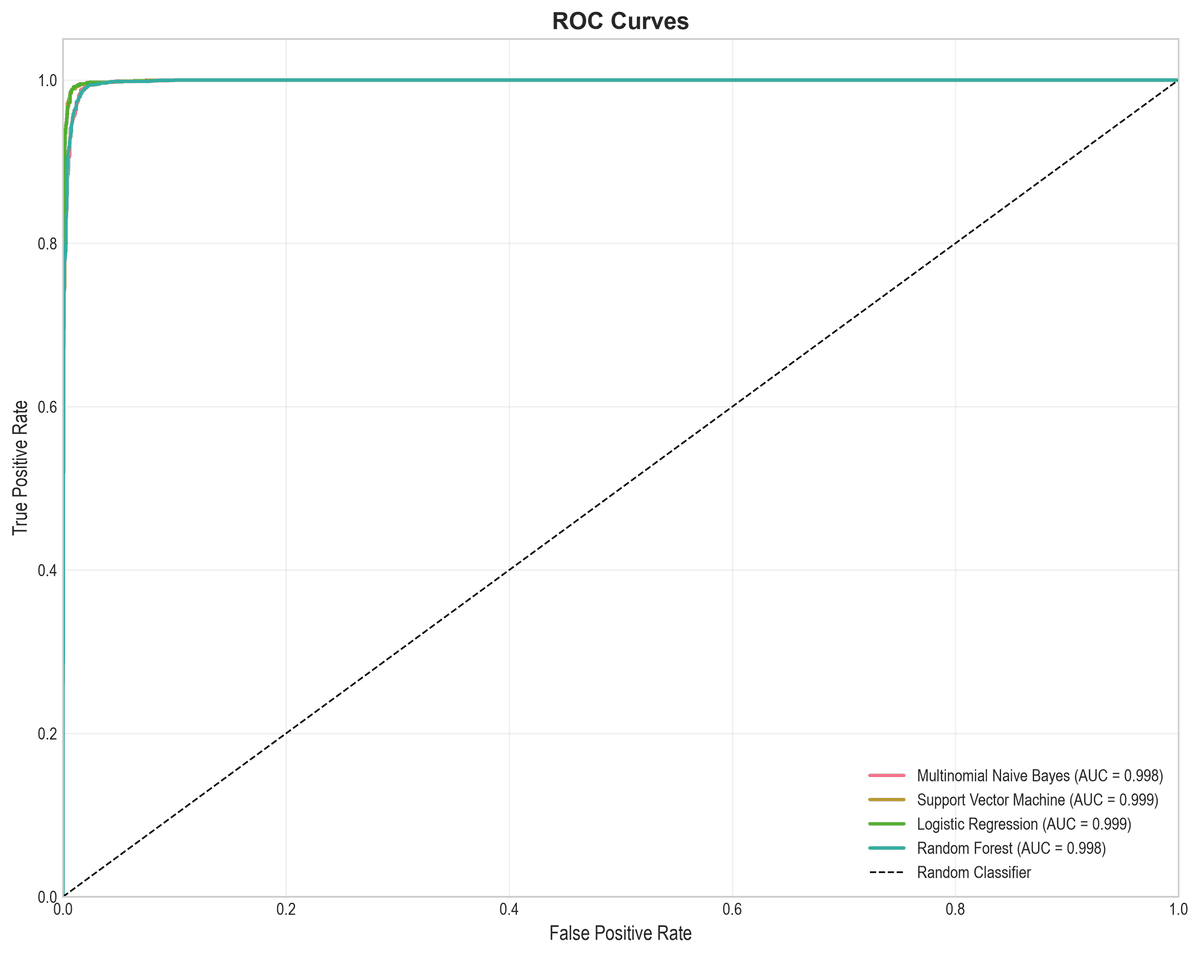
3. ROC Curves & AUC Score
Receiver Operating Characteristic curves showing false positive vs true positive rate tradeoffs.
4. Training Time Comparison
Execution time in seconds for model training and 5-fold cross-validation.
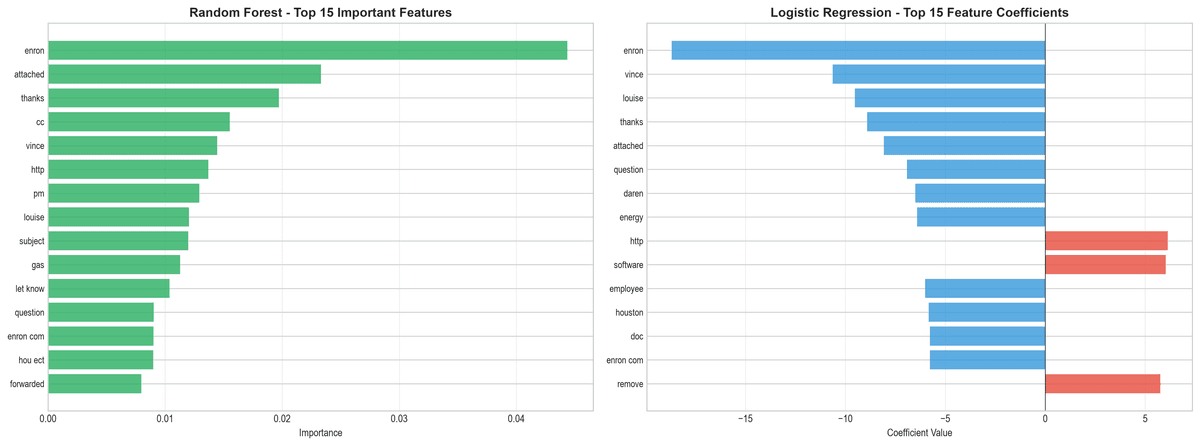
5. Feature Importance & Top Words
Top TF-IDF feature weights that indicate spam vs ham classification.